The Myth of High Beta

“Can investors forego short-term thrill for long-term reward?”
In a rational investment market, investors demand higher returns to compensate for higher risk. Therefore, one should logically expect lower returns from safer securities and higher returns from riskier securities. This has long been one of investing’s fundamental precepts. However, rational is not always an accurate description of investor behavior. This paper questions the long-held belief – some would say myth – that higher risk, high beta stocks deliver the highest returns. Furthermore, we present studies that show how the “low volatility anomaly” creates opportunities to beat the market and create long-term wealth.
Market Efficiency and the Value of Active Management
In order for people to believe they (or their professional money manager) can beat the market, they must start with the notion that markets are mostly, but not always efficient. If the stock market were perfectly efficient, it would be futile to pay an active money manager. A low-cost index fund would certainly be the best alternative.
Though the aggregated performance of professional investment managers may at times support a case for index funds, a deeper understanding of market dynamics and investor psychology reinforces the potential value of active management and may help investors determine which managers and strategies are better suited to beat the market.
For active managers to gain an edge, there must be market anomalies or inefficiencies. These anomalies must not only exist in the short term but also persist over the long term. In our view, some of the same human behavioral biases that cause investor error also allow anomalies to recur time and time again. In this paper, we discuss investors’ love affair with high beta stocks, as well as the low beta/low volatility anomaly and the natural human tendencies that sustain it. Most importantly, we show how this anomaly creates opportunities to outperform the market with less risk, casting doubt on the well-entrenched myth that high beta stocks are the surest path to higher returns.
The Efficient Market Hypothesis Requires Rational Investor Behavior
Known for his Journal of Finance article, “Efficient Capital Markets: A Review of Theory and Empirical Work,” Nobel Prize Laureate Eugene Fama theorizes that all information is already reflected in all stock prices, thus making it impossible to outperform the market (Fama, 1970). According to the Efficient-Market Hypothesis (EMH), stocks always reflect all available information, eliminating any possibility of purchasing undervalued stocks or selling stocks at inflated prices. If the hypothesis holds, investors – whether professional or not – should be unable to outperform the overall market through stock selection or market timing. The only way investors could obtain higher returns is by taking on additional risk through high beta stocks.
There are many models that attempt to explain the risk-reward relationship of stocks relative to the market portfolio. The Capital Asset Pricing Model (CAPM), which uses a single factor (beta) to explain pricing and asset returns, was a remarkable breakthrough in finance that won William Sharpe the 1990 Nobel Prize in Economics. Unfortunately, beta alone has not done a very good job of explaining observed market risk and returns.
In order for the EMH to hold, investors must be risk-averse and always make rational investment choices. This assumption doesn’t always prove true, however, and many academics have tried to explain why. This has spawned an area of study known as behavioral finance or behavioral economics. Behavioral finance grew from the idea that individuals aren’t always rational and quite often make irrational decisions. There have been many studies on behavioral finance by psychologists such as Daniel Kahneman, Amos Tversky, and Richard Thaler to name just a few. Behavioral economists attribute imperfections in financial markets to a combination of cognitive biases, some of which we’ll review in this paper.
Stock Market Bubbles: Collective Wisdom or Irrational Decision Making?
Stock market bubbles are a notable outcome of irrational decision making. Bubbles occur when market participants drive stock prices above their value relative to some system of stock valuation. In the 20th century, the stock market experienced a number of bubbles, including the bubble that preceded the Great Depression and the dot-com Bubble of the late 1990s. Both were fueled by speculative activity involving new technologies. The 1920s saw amazing innovations including radio, automobiles, and aviation. In the 1990s, the Internet and e-commerce technologies emerged.
Some analysts, affirming crowd-sourced wisdom, theorize that price movements, even bubbles, really do reflect rational expectations of fundamental returns. Behavioral finance theory, on the other hand, attributes stock market bubbles to cognitive biases, including the tendency to overpay for excitement, herd instinct, regret avoidance and other common human tendencies. There’s also a more cynical school of thought that one can make money buying securities, whether overvalued or not, because there will always be someone (a greater fool) who is willing to buy that stock at a higher price. In our view, stock market bubbles provide clear evidence that investors do not always act rationally.
Investors’ High Beta Addiction
Whether we like to admit it or not, we all probably agree that the latest, greatest smartphone or a new social media company is much more exciting (though not necessarily more profitable) than a company that sells salad dressing or creates software for government agencies. In general, financial news is not the most exciting subject matter, so it’s no surprise that financial newscasters spice up their reports and juice their ratings with news of exciting high growth companies. Investors too are beguiled by what are typically classified as “high beta” stocks and sometimes referred to colloquially as “glamor” or “speculative” stocks.
Stocks are tagged as high beta when they exhibit high growth and high price momentum. These stocks are expected to rise more than the overall market in good times and fall more than the market in bad times. They may involve specific speculative risks, for example, uncertainty about an event that may produce either a profit or loss. However, investors who own these stocks are all too willing to take on added risk in hopes of a commensurate payoff. Let’s look at some of the behavioral biases behind this attraction.
Blackjack, Baseball and Beta – Why People Overpay for Excitement
Looking at irrational gambling behaviors may shed some light on why investors prefer high beta stocks. Think about someone who gambles online or loses significant sums playing blackjack at a casino. They very likely view gambling as a low-risk, high-yield proposition. In reality, it’s the opposite: a high-risk, low-yield proposition. The payouts of every casino game always favor the casino which is called the “house edge” or “house advantage.” For example, for each bet on the roulette wheel, the casino keeps 5.26% of winnings on average. Blackjack, the most popular table game, returns a bit more in winnings than roulette, but it too is subject to what is called the house edge. Yet, according to The Wall Street Journal, the U.S. still spent $104.1 billion on gambling in 2015 (WSJ 2016). The thrill of hitting a casino jackpot is often just too alluring – despite its improbability. Excitement and anticipation create a natural high, an adrenaline rush. Studies show that people get this same feeling when buying exciting high momentum growth stocks.
Three experts in the field of Neuroeconomics, Wolfram Schultz, Read Montague, and Peter Dayan have written studies showing that financial gains trigger the release of dopamine, a brain chemical that stimulates a natural high. The studies have shown that the less likely or predictable a financial gain, the more dopamine is released and the longer it affects the brain. This may explain why gamblers are drawn to low-probability bets with high potential payoffs. When such bets pay off, they produce an actual physiological change; a massive dopamine release floods the brain with a soft euphoria. Through the use of MRI technology, Schultz and Montague also found similarity between the brains of people who have successfully predicted financial gains and the brains of people addicted to morphine or cocaine. After a few successful predictions, financial speculators can literally become addicted to the dopamine release.
A person with high dopamine levels typically becomes over-confident and tends to take undue risk. This may cause gamblers to wrongly attribute success to their own prowess or “system” rather than luck. Addiction to the dopamine kick may keep them playing until they lose all their money. Similarly, some investors become “addicted” to hot high beta speculative stocks. The excitement triggers dopamine. On the other hand, successful investors like Warren Buffet often make money in boring industries like insurance, finance, railroads, food, and beverage. With less excitement, there’s likely less risk of dopamine over-riding one’s more rational decision-making abilities.
Turning to baseball, another popular U.S. pastime, the bestselling book “Moneyball: The Art of Winning an Unfair Game” by Michael Lewis provides a concrete example of overpaying for excitement. While most Major League Baseball teams hired expensive home run hitters that fans loved to watch, Oakland Athletics general manager Billy Beane favored an analytical, evidence-based approach to assembling a competitive team. Oakland hired undervalued players who more consistently got on base with a walk or a single. Even though sabermetrics (the empirical analysis of baseball stats) clearly indicated that on-base percentage was critical to offensive productivity, the baseball labor market seriously undervalued that factor.
Overpaying for home runs and underpaying for walks and singles is quite similar to investors’ preference for “speculative/ high beta” stocks over stocks that deliver singles year after year. Many believe the Moneyball anomaly corrected once it was exposed, which may be true since there are only 30 MLB teams. However, in order to correct a parallel anomaly in the stock market, millions of “players” would have to be persuaded to forego the thrill of buying speculative high beta stocks.
There are a number of other human tendencies that may contribute to investors’ preference for high beta stocks. These include:
- The Lottery Effect: Like casino games, lotteries are high risk, low yield games. According to the Multi-State Lottery Association, which oversees the Powerball Lottery, the odds of matching all numbers is 292,201,338 to 1. Payouts from lotteries are even worse than casinos, as states take a cut of total receipts to support government expenditures. In Illinois, for example, lottery receipts totaled $2.84 billion for Fiscal Year 2015. Of this amount, only 64% of gross lottery revenue is actually paid out in prizes. The rest goes to expenses associated with running the lottery and state capital projects. Why then is the lottery so attractive to so many people? One reason is that people tend to (optimistically) assign more weight to the probability of winning than is justified objectively. Second, people like the idea of spending a very small amount with the possibility (no matter how slight) of winning big. Similarly, many investors are attracted to low-priced, high-risk stocks for the slight possibility of jackpot size returns.
- Herd Instinct: Nobody wants to miss a great opportunity and when a stock is rising, everyone wants to be on the bandwagon. Being a contrarian or value investor isn’t as easy or fun as buying trendy stocks. It’s hard work determining why a stock is out-of-favor, whether it has reached its lowest price, when or if the company will fix its problems and if that company has sufficient liquidity to survive in the interim. Even when investors believe a company’s problems are temporary, it’s psychologically difficult to watch a stock make new lows or to continually add to a stock that keeps missing earnings. It’s much easier to join in the pep rally for a stock on its way up. This is true even for professional investors, who find safety in numbers. In practical terms, a manager is less likely to be fired when other investors and fund managers are buying the same favored stocks.
- Regret Avoidance: What were people thinking in 1999 when stock prices entered astronomical territory? Many clearly believed stocks would keep rising and didn’t want to miss any of the ride. People often stick with a high flying stock to avoid the regret of selling too soon. How would they feel if they had sold in 1997 only to see the market go up for two more years?
- Faulty Extrapolation: A tendency to extrapolate the current situation – whether good or bad – leads investors to over penalize companies with short-term issues, erroneously believing the bad news will have a larger and longer impact than it actually does. Similarly, investors too often extrapolate recent good earnings growth too far into the future. This leads to under-discounting stocks with current earnings momentum.
- The “Hot Hand” Effect: Like blackjack players with a “hot hand,” investors may attribute too much of their success to their own abilities. Furthermore, the good feeling associated with winning may fuel unfounded optimism that success will continue. Unfortunately, this may persuade investors to commit even more money to the market, all too often at cycle peaks when stocks are most expensive.
The Low Beta/Low Volatility Anomaly
So far we have focused on why investors are so attracted to high beta stocks. Let’s now consider whether they are rewarded for their devotion. The notion that high beta stocks should earn higher average returns than low beta stocks has been a cornerstone of modern finance. In an efficient market, investors should enjoy above-average returns only when they take above-average risks. In reality, this isn’t always the case. Over the last 20 years, there has been a significant academic investigation into the relationship between volatility and performance. Study after study has concluded that investors are not appropriately rewarded for taking either systematic (beta) or idiosyncratic (company specific) risk.
There is a persistent anomaly in the risk/return trade-off between high and low beta stocks. Portfolios of low-volatility stocks have produced higher risk-adjusted returns than portfolios of high-volatility stocks. For investors, this is a sort of “Holy Grail” – higher returns with less risk.
The outperformance of low beta stocks and portfolios is not a new discovery. In addition to academic evidence, which we review below, there’s also a growing interest on the part of investors. Following the dot.com bust and the financial crisis of 2008, baby boomers have been burned in the market too many times and seem to be more emotionally ready to tone down the “excitement” in their portfolios in the interest of preserving their hard earned money for retirement.
Academic Support for the Low Beta Anomaly
As early as 1972, Jensen, Black, and Scholes demonstrated that the expected excess return on a security was not linearly related to its beta (Jensen, et al., 1972). The authors found that high beta stocks have negative alphas (i.e. are overvalued) and low beta stocks have positive alphas (are underpriced). Fama and French also observed a weak positive relationship between average return and beta. Low-beta portfolios had average returns that were similar or higher than those of high-beta portfolios (Fama, et al., 1992).
- “Benchmarks as Limits to Arbitrage: Understanding the Low-Volatility Anomaly” One of the better studies on this subject comes from Baker, Bradley, and Wurgler (Baker, et al., 2011). Their study points to low beta as one of the greatest anomalies in finance. The authors find that “over the 1968 to 2008 period, low-volatility and low-beta portfolios offered an enviable combination of high average returns and small drawdowns [less risk].” Figure 1 shows the return of $1 invested in 1968 in each of five quintiles of stocks divided by volatility and beta measurements. The bottom quintile (or lowest risk) stocks outperform the upper four quintiles from January 1968 to December 2008.
Figure 1
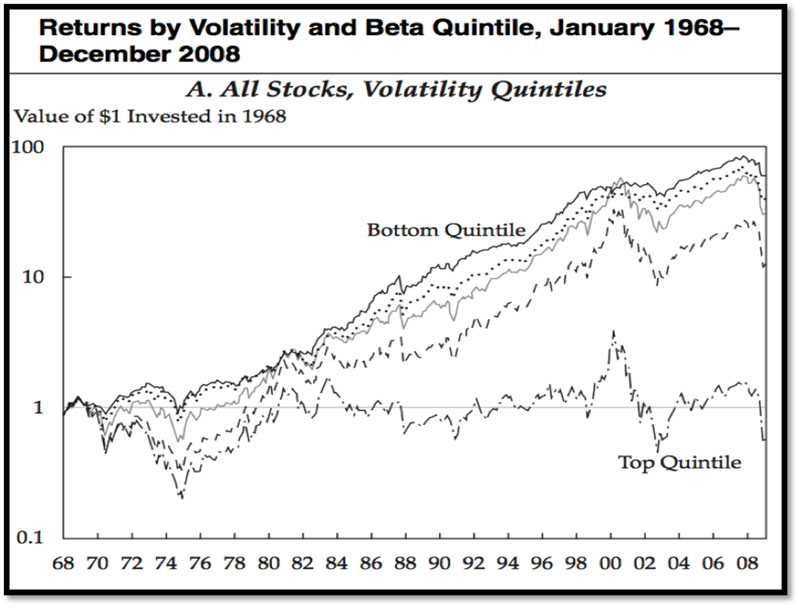
Source: Baker, Bradley, and Wurgler 2011
- “Low Risk Stocks Outperform within All Observable Markets of the World” Baker and Haugen (2012) studied the average annual return and riskiness of stocks in 21 developed countries and 12 emerging markets from 1990 to 2011. They compared the stocks in the lowest decile of risk (lowest volatility) to the stocks in the highest decile of risk (highest volatility). Figure 2 illustrates the stark contrast between the performance of these two stock groups clearly showing a negative relationship between the risk of an investment and its corresponding return.
Figure 2
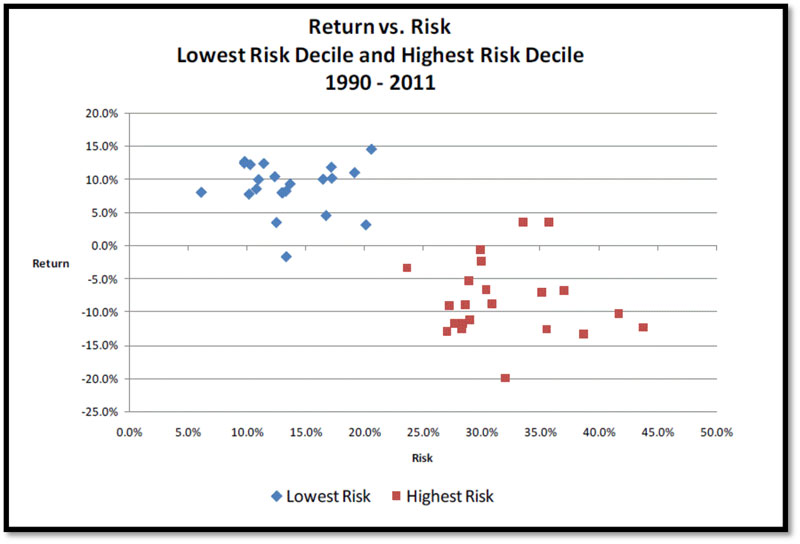
Source: Baker and Haugen 2012
- “The Volatility Effect: Lower Risk without Lower Return”Blitz and van Vliet (2007) present empirical evidence that stocks with low volatility earn high risk-adjusted returns. They find that “the annual alpha spread of global low versus high volatility decile portfolios amounts to 12% over the 1986-2006 period.” Their results indicate that equity investors overpay for risky stocks and they argue that investors should consider low risk stocks as a separate asset class when determining their asset allocation. Figure 3 demonstrates a clear relationship between expected volatility and actual risk-adjusted returns.
Figure 3
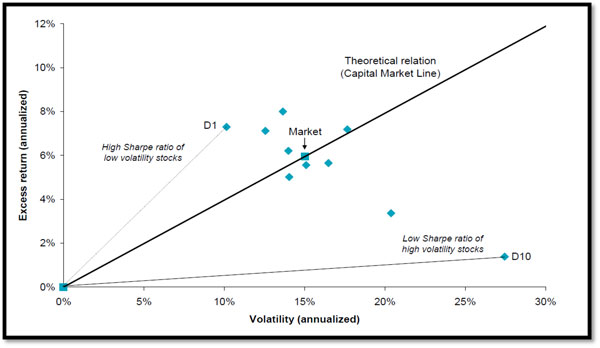
Source: David C. Blitz and Pim van Vliet (2007) Sharpe ratio uses standard deviation to measure a fund’s risk-adjusted returns. The higher a fund’s Sharpe ratio, the better a fund’s returns have been relative to its risk.
- “Betting against beta” Frazzini and Pedersen (2014) demonstrate that the beta anomaly existed in many asset classes such as U.S. equities, 19 international equity markets, Treasury bonds, corporate bonds, and futures from January 1989 to March 2012. They determine that investors bid up high-beta assets resulting in low alphas. Figure 4 ranks U.S. and international equities from lowest beta (P1) to highest beta (P10) during the study period and shows their corresponding alphas.
Figure 4
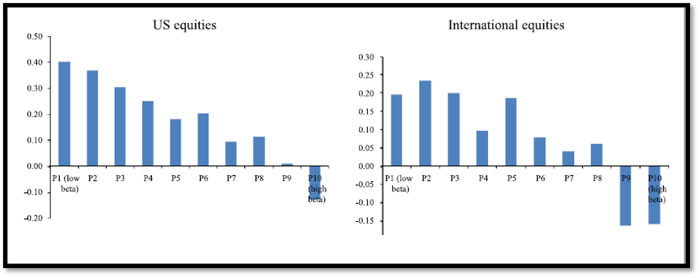
Source: Frazzini and Pedersen (2014)
- “Quality Minus Junk” Clifford Asness, Andrea Frazzini, and Lasse H. Pedersen (2014) define a quality security as “one that has characteristics that, all-else-equal, an investor should be willing to pay a higher price for: stocks that are safe, profitable, growing, and well managed.” The study’s authors found that “high-quality stocks have historically delivered high risk-adjusted returns, while low-quality junk stocks delivered negative risk-adjusted returns.” Figure 5 shows cumulative returns of Quality minus Junk (QMJ) factors. This figure includes results from their Long Sample of domestic stocks from June 1956 to December 2012
Figure 5
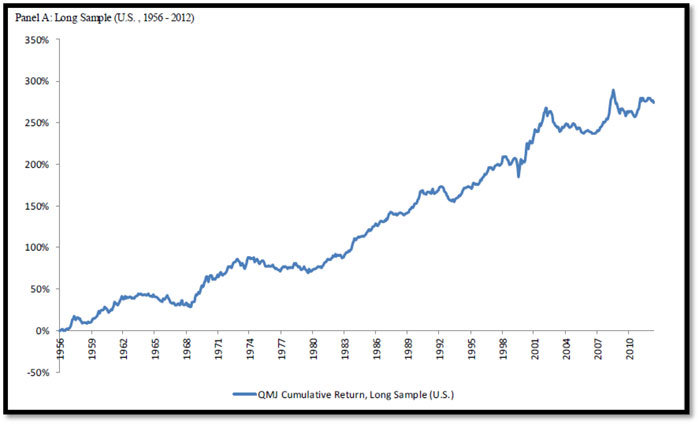
Source: Clifford Asness, Andrea Frazzini, and Lasse H. Pedersen (2014)
- “High idiosyncratic volatility and low returns: International and further U.S. evidence”Ang, Hodrick, Xing and Zhang (2009) found that “Stocks with recent past high idiosyncratic volatility have low future average returns around the world. Across 23 developed markets, the difference in average returns between the extreme quintile [high volatility] portfolios sorted on idiosyncratic volatility is -1.31% per month, after controlling for world market, size, and value factors. The effect is individually significant in each G7 country.”
Conclusion
The belief that high beta stocks are the answer to investors’ long-term investment success is a myth that has been burned into our collective psyche. Yet a plethora of academic research and well-documented historical market results show that portfolios of low volatility stocks are better suited to deliver above-average returns over longer time frames. The fundamental question now facing investors is whether they are willing to forego the short-term thrill of owning so-called glamor stocks in exchange for the ultimate reward of achieving their long-term investment goals.
Bibliography
Ang, Andrew and Robert J. Hodrick and Yuhang Xing and Xiaoyan Zhang “High idiosyncratic volatility and low returns: International and further U.S. evidence,” Journal of Financial Economics, Elsevier, 2009 vol. 91(1), pages 1-23, January.
Asness, Clifford S. and Andrea Frazzini and Lasse Heje Pedersen “Quality Minus Junk” (June 19, 2014). Available at SSRN 2312432
Baker, Malcolm and Brendan Bradley and Jeffrey Wurgler “Benchmarks as limits to arbitrage: Understanding the low-volatility anomaly.” Financial Analysts Journal 67.1 (2011): 40-54.
Baker, Nardin L. and Robert A. Haugen “Low-risk stocks outperform within all observable markets of the world.” (2012). Available at SSRN 2055431
Blitz, David and Pim Van Vliet “The volatility effect: Lower risk without lower return.” Journal of Portfolio Management (2007): 102-113.
Berzon, Alexandria “You Think You Know the Gambling Business?” The Wall Street Journal, September 19, 2016, Section R2.
Cowan, David and Sam Wilderman “Re-thinking risk: what the beta puzzle tells us about investing.” White paper, GMO (November 2011).
Fama, Eugene “Efficient capital markets: A review of theory and empirical work.” The journal of Finance 25.2. – 1970. – pp. 383-417.
Fama, Eugene and Kenneth French “The cross-section of expected stock returns.” Journal of Finance. – 1992. – pp. 427-465.
Fong, Wai Mun The lottery mindset: Investors, gambling, and the stock market. Springer, 2014.
Frazzini, Andrea and Lasse Heje Pedersen “Betting against beta.” Journal of Financial Economics 111.1 (2014): 1-25.
Illinois State Budget Fiscal Year 2017 p.335. Available at www.illinois.gov
Jensen, Michael and Fisher Black and Myron Scholes “The capital asset pricing model: Some empirical tests.” (1972). Available at SSRN 908569
Lewis, Michael “Moneyball: The Art of Winning an Unfair Game” W. W. Norton & Company; 1st edition (March 17, 2004)
Schultz, Wolfram “Getting formal with dopamine and reward.” Neuron 36.2 (2002): 241-263.
Schultz, Wolfram and Peter Dayan and P. Read Montague “A neural substrate of prediction and reward.” Science 275.5306 (1997): 1593-1599.
Zweig, Jason “Your money and your brain: how the new science of neuroeconomics can help make you rich.” Simon and Schuster, 2007.